Eastern Yellow Robin
Eopsaltria australis
ABR description
The following is extracted from the Annual Bird Report for the twelve months to June 2017.
Common, breeding resident
Occurs mainly in the moist forest of the western dividing range, but also in smaller numbers in wet gullies and along watercourses.
General: The reporting rate (2.7%) is down slightly on last year and down 21% on the 10YA and 53% on the 30YA. The reporting rate has been in ever so gentle decline since 1992 to its lowest level ever. Present all year with slightly more in summer (30%), spring (26%) and autumn (26%). Records from wide-ranging sites, including ANBG (80 records), Bibaringa (14), and in the Brindabellas and along the Murrumbidgee and Molonglo Rivers. Max 8/9 Jan Gigerline NR (SmA1), mean 1.7, median 1. 7 breeding records: earliest br/23 Oct Jedbinbilla GrI17 (CnM1), and latest dy/6 Mar TNR Lyrebird Trail (LaK1).
GBS: 39 records (59 last year) throughout the year from the same 2 rural sites that have provided most of the records in recent years. 34 records from Carwoola (BuM1) and 5 records from Burra (AnI1) over 35 weeks with more records in summer (38%) this year. Records are of 1 or 2 birds. No breeding records, 1 in Carwoola 3 years ago.
Abundance
Abundance is the average number of birds of that species per survey. Where the species was observed (presence recorded) but the number of birds seen was not recorded, this is treated as a count of zero.
Abundance by year
This chart shows the abundance of Eastern Yellow Robin between 1982 and 2017. 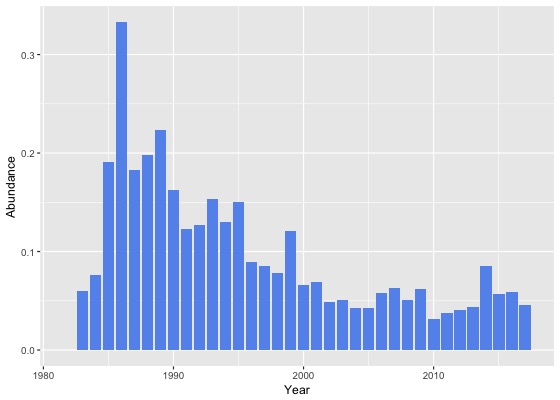
Abundance by month
This chart shows the monthly abundance of Eastern Yellow Robin. The blue lines show the abundance for the twelve months to June 2017 and the bars show the average abundance for the period 1982 to 2017. 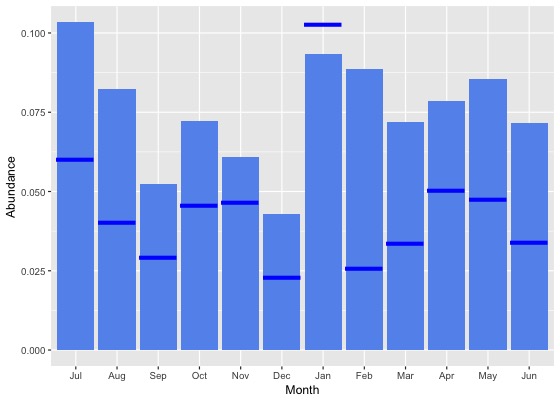
Abundance by season
This chart shows the seasonal abundance of Eastern Yellow Robin. The blue lines show the seasonal abundance for the twelve months to June 2017 and the bars show the average seasonal abundance for the period 1982 to 2017. 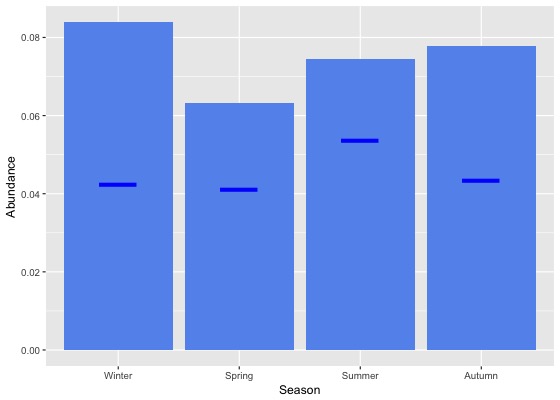
Abundance data
| Month | Season | ||||||||||||||||||
|---|---|---|---|---|---|---|---|---|---|---|---|---|---|---|---|---|---|---|---|
| Period | Jul | Aug | Sep | Oct | Nov | Dec | Jan | Feb | Mar | Apr | May | Jun | Winter | Spring | Summer | Autumn | All | ||
| All years | |||||||||||||||||||
| All | 0.1 | 0.1 | 0.1 | 0.1 | 0.1 | 0.0 | 0.1 | 0.1 | 0.1 | 0.1 | 0.1 | 0.1 | 0.1 | 0.1 | 0.1 | 0.1 | 0.1 | ||
| Previous years | |||||||||||||||||||
| All previous years | 0.1 | 0.1 | 0.1 | 0.1 | 0.1 | 0.0 | 0.1 | 0.1 | 0.1 | 0.1 | 0.1 | 0.1 | 0.1 | 0.1 | 0.1 | 0.1 | 0.1 | ||
| Previous 30 years | 0.1 | 0.1 | 0.1 | 0.1 | 0.1 | 0.0 | 0.1 | 0.1 | 0.1 | 0.1 | 0.1 | 0.1 | 0.1 | 0.1 | 0.1 | 0.1 | 0.1 | ||
| Previous 20 years | 0.1 | 0.1 | 0.0 | 0.1 | 0.0 | 0.0 | 0.1 | 0.1 | 0.1 | 0.1 | 0.1 | 0.1 | 0.1 | 0.0 | 0.1 | 0.1 | 0.1 | ||
| 10 year groups | |||||||||||||||||||
| [2007,2017) | 0.1 | 0.0 | 0.0 | 0.1 | 0.0 | 0.0 | 0.1 | 0.1 | 0.1 | 0.1 | 0.1 | 0.1 | 0.1 | 0.0 | 0.1 | 0.1 | 0.1 | ||
| [1997,2007) | 0.1 | 0.1 | 0.0 | 0.1 | 0.1 | 0.0 | 0.1 | 0.1 | 0.1 | 0.0 | 0.1 | 0.0 | 0.1 | 0.1 | 0.1 | 0.1 | 0.1 | ||
| [1987,1997) | 0.2 | 0.2 | 0.1 | 0.1 | 0.1 | 0.1 | 0.2 | 0.2 | 0.2 | 0.2 | 0.2 | 0.2 | 0.2 | 0.1 | 0.2 | 0.2 | 0.2 | ||
| 5 year groups | |||||||||||||||||||
| [2012,2017) | 0.1 | 0.0 | 0.0 | 0.1 | 0.0 | 0.0 | 0.1 | 0.1 | 0.1 | 0.1 | 0.1 | 0.1 | 0.1 | 0.0 | 0.1 | 0.1 | 0.1 | ||
| [2007,2012) | 0.0 | 0.0 | 0.0 | 0.1 | 0.0 | 0.0 | 0.1 | 0.1 | 0.1 | 0.0 | 0.1 | 0.0 | 0.0 | 0.0 | 0.1 | 0.1 | 0.0 | ||
| [2002,2007) | 0.1 | 0.0 | 0.0 | 0.0 | 0.1 | 0.0 | 0.1 | 0.1 | 0.0 | 0.0 | 0.1 | 0.0 | 0.1 | 0.0 | 0.1 | 0.0 | 0.0 | ||
| [1997,2002) | 0.2 | 0.1 | 0.1 | 0.1 | 0.0 | 0.0 | 0.1 | 0.2 | 0.1 | 0.1 | 0.1 | 0.1 | 0.1 | 0.1 | 0.1 | 0.1 | 0.1 | ||
| [1992,1997) | 0.2 | 0.2 | 0.1 | 0.1 | 0.1 | 0.1 | 0.2 | 0.1 | 0.1 | 0.2 | 0.1 | 0.1 | 0.2 | 0.1 | 0.1 | 0.1 | 0.1 | ||
| [1987,1992) | 0.2 | 0.2 | 0.2 | 0.2 | 0.2 | 0.2 | 0.2 | 0.2 | 0.2 | 0.2 | 0.2 | 0.2 | 0.2 | 0.2 | 0.2 | 0.2 | 0.2 | ||
| Year | |||||||||||||||||||
| 2017 | 0.1 | 0.0 | 0.0 | 0.0 | 0.0 | 0.0 | 0.1 | 0.0 | 0.0 | 0.1 | 0.0 | 0.0 | 0.0 | 0.0 | 0.1 | 0.0 | 0.0 | ||
| 2016 | 0.1 | 0.0 | 0.0 | 0.1 | 0.0 | 0.0 | 0.1 | 0.1 | 0.1 | 0.1 | 0.0 | 0.1 | 0.1 | 0.1 | 0.1 | 0.1 | 0.1 | ||
| 2015 | 0.1 | 0.1 | 0.0 | 0.1 | 0.0 | 0.0 | 0.1 | 0.1 | 0.1 | 0.1 | 0.0 | 0.1 | 0.1 | 0.0 | 0.1 | 0.1 | 0.1 | ||
| 2014 | 0.0 | 0.0 | 0.0 | 0.1 | 0.0 | 0.1 | 0.1 | 0.1 | 0.1 | 0.1 | 0.1 | 0.1 | 0.1 | 0.1 | 0.1 | 0.1 | 0.1 | ||
| 2013 | 0.0 | 0.0 | 0.0 | 0.1 | 0.0 | 0.0 | 0.1 | 0.1 | 0.0 | 0.0 | 0.1 | 0.1 | 0.1 | 0.0 | 0.0 | 0.0 | 0.0 | ||
| 2012 | 0.0 | 0.0 | 0.0 | 0.1 | 0.0 | 0.0 | 0.1 | 0.1 | 0.0 | 0.1 | 0.0 | 0.1 | 0.0 | 0.0 | 0.0 | 0.0 | 0.0 | ||
| 2011 | 0.1 | 0.0 | 0.0 | 0.1 | 0.0 | 0.0 | 0.0 | 0.1 | 0.0 | 0.0 | 0.0 | 0.0 | 0.0 | 0.0 | 0.0 | 0.0 | 0.0 | ||
| 2010 | 0.1 | 0.0 | 0.0 | 0.0 | 0.0 | 0.0 | 0.0 | 0.0 | 0.0 | 0.1 | 0.0 | 0.0 | 0.0 | 0.0 | 0.0 | 0.0 | 0.0 | ||
| 2009 | 0.0 | 0.1 | 0.0 | 0.1 | 0.0 | 0.0 | 0.1 | 0.1 | 0.1 | 0.1 | 0.1 | 0.0 | 0.0 | 0.1 | 0.1 | 0.1 | 0.1 | ||
| 2008 | 0.0 | 0.0 | 0.1 | 0.1 | 0.0 | 0.0 | 0.2 | 0.1 | 0.0 | 0.0 | 0.1 | 0.0 | 0.0 | 0.1 | 0.1 | 0.0 | 0.1 | ||
| 2007 | 0.1 | 0.1 | 0.0 | 0.1 | 0.0 | 0.0 | 0.1 | 0.2 | 0.1 | 0.0 | 0.1 | 0.1 | 0.1 | 0.0 | 0.1 | 0.1 | 0.1 | ||
| 2006 | 0.0 | 0.0 | 0.0 | 0.1 | 0.1 | 0.0 | 0.1 | 0.1 | 0.1 | 0.0 | 0.1 | 0.1 | 0.1 | 0.1 | 0.0 | 0.1 | 0.1 | ||
| 2005 | 0.1 | 0.0 | 0.0 | 0.0 | 0.0 | 0.1 | 0.1 | 0.1 | 0.0 | 0.0 | 0.1 | 0.0 | 0.0 | 0.0 | 0.1 | 0.0 | 0.0 | ||
| 2004 | 0.1 | 0.0 | 0.0 | 0.0 | 0.1 | 0.0 | 0.1 | 0.1 | 0.0 | 0.0 | 0.0 | 0.0 | 0.0 | 0.0 | 0.1 | 0.0 | 0.0 | ||
| 2003 | 0.1 | 0.1 | 0.0 | 0.0 | 0.0 | 0.0 | 0.0 | 0.0 | 0.1 | 0.1 | 0.1 | 0.0 | 0.1 | 0.0 | 0.0 | 0.1 | 0.1 | ||
| 2002 | 0.1 | 0.1 | 0.0 | 0.0 | 0.1 | 0.0 | 0.0 | 0.1 | 0.0 | 0.0 | 0.1 | 0.1 | 0.1 | 0.0 | 0.0 | 0.0 | 0.0 | ||
| 2001 | 0.1 | 0.1 | 0.1 | 0.1 | 0.1 | 0.0 | 0.0 | 0.2 | 0.0 | 0.0 | 0.1 | 0.0 | 0.1 | 0.1 | 0.1 | 0.1 | 0.1 | ||
| 2000 | 0.1 | 0.1 | 0.0 | 0.1 | 0.1 | 0.0 | 0.1 | 0.1 | 0.0 | 0.1 | 0.0 | 0.1 | 0.1 | 0.1 | 0.1 | 0.1 | 0.1 | ||
| 1999 | 0.6 | 0.3 | 0.1 | 0.1 | 0.1 | 0.0 | 0.1 | 0.2 | 0.2 | 0.0 | 0.1 | 0.0 | 0.2 | 0.1 | 0.1 | 0.1 | 0.1 | ||
| 1998 | 0.0 | 0.1 | 0.2 | 0.1 | 0.0 | 0.0 | 0.0 | 0.2 | 0.0 | 0.1 | 0.2 | 0.1 | 0.1 | 0.1 | 0.1 | 0.1 | 0.1 | ||
| 1997 | 0.2 | 0.1 | 0.0 | 0.1 | 0.0 | 0.0 | 0.1 | 0.2 | 0.3 | 0.1 | 0.0 | 0.1 | 0.1 | 0.0 | 0.1 | 0.1 | 0.1 | ||
| 1996 | 0.2 | 0.1 | 0.0 | 0.1 | 0.1 | 0.1 | 0.1 | 0.1 | 0.0 | 0.1 | 0.3 | 0.0 | 0.1 | 0.0 | 0.1 | 0.1 | 0.1 | ||
| 1995 | 0.4 | 0.2 | 0.1 | 0.1 | 0.1 | 0.1 | 0.2 | 0.0 | 0.2 | 0.1 | 0.0 | 0.2 | 0.3 | 0.1 | 0.1 | 0.1 | 0.1 | ||
| 1994 | 0.1 | 0.2 | 0.0 | 0.2 | 0.0 | 0.0 | 0.2 | 0.4 | 0.1 | 0.1 | 0.1 | 0.1 | 0.1 | 0.1 | 0.2 | 0.1 | 0.1 | ||
| 1993 | 0.1 | 0.2 | 0.3 | 0.0 | 0.1 | 0.0 | 0.3 | 0.0 | 0.2 | 0.2 | 0.1 | 0.1 | 0.2 | 0.1 | 0.1 | 0.2 | 0.2 | ||
| 1992 | 0.1 | 0.1 | 0.2 | 0.1 | 0.3 | 0.0 | 0.1 | 0.1 | 0.1 | 0.2 | 0.2 | 0.0 | 0.1 | 0.2 | 0.1 | 0.2 | 0.1 | ||
| 1991 | 0.0 | 0.2 | 0.0 | 0.1 | 0.2 | 0.0 | 0.2 | 0.2 | 0.1 | 0.4 | 0.0 | 0.2 | 0.1 | 0.1 | 0.1 | 0.2 | 0.1 | ||
| 1990 | 0.2 | 0.2 | 0.2 | 0.0 | 0.1 | 0.1 | 0.1 | 0.1 | 0.1 | 0.2 | 0.2 | 0.3 | 0.2 | 0.1 | 0.1 | 0.2 | 0.2 | ||
| 1989 | 0.2 | 0.2 | 0.2 | 0.2 | 0.2 | 0.3 | 0.2 | 0.3 | 0.2 | 0.2 | 0.3 | 0.2 | 0.2 | 0.2 | 0.3 | 0.2 | 0.2 | ||
| 1988 | 0.3 | 0.2 | 0.2 | 0.2 | 0.1 | 0.2 | 0.2 | 0.2 | 0.3 | 0.2 | 0.2 | 0.2 | 0.2 | 0.2 | 0.2 | 0.2 | 0.2 | ||
| 1987 | 0.1 | 0.5 | 0.1 | 0.2 | 0.2 | 0.1 | 0.1 | 0.2 | 0.2 | 0.2 | 0.2 | 0.2 | 0.2 | 0.2 | 0.2 | 0.2 | 0.2 | ||
| 1986 | 0.4 | 0.1 | 0.4 | 0.2 | 0.4 | 0.2 | 0.5 | 0.4 | 0.5 | 0.4 | 0.3 | 0.4 | 0.3 | 0.3 | 0.4 | 0.4 | 0.3 | ||
| 1985 | 0.3 | 0.1 | 0.1 | 0.2 | 0.2 | 0.1 | 0.2 | 0.2 | 0.5 | 0.4 | 0.4 | 0.2 | 0.2 | 0.2 | 0.1 | 0.4 | 0.2 | ||
| 1984 | 0.0 | 0.0 | 0.0 | 0.0 | 0.0 | 0.0 | 0.1 | 0.1 | 0.2 | 0.0 | 0.2 | 0.0 | 0.0 | 0.0 | 0.1 | 0.1 | 0.1 | ||
| 1983 | 0.0 | 0.0 | 0.0 | 0.1 | 0.4 | 0.1 | 0.0 | 0.0 | 0.0 | - | 0.0 | 0.0 | 0.0 | 0.2 | 0.0 | 0.0 | 0.1 | ||
| 1982 | - | 0.0 | - | 0.0 | 0.0 | 0.0 | - | 0.0 | - | 0.0 | - | 0.0 | 0.0 | 0.0 | 0.0 | 0.0 | 0.0 | ||
Reporting rates
Reporting rate is the proportion of all surveys in which the species was present.
Reporting rate by year
This chart shows the reporting rate of Eastern Yellow Robin each year between 1982 and 2017. 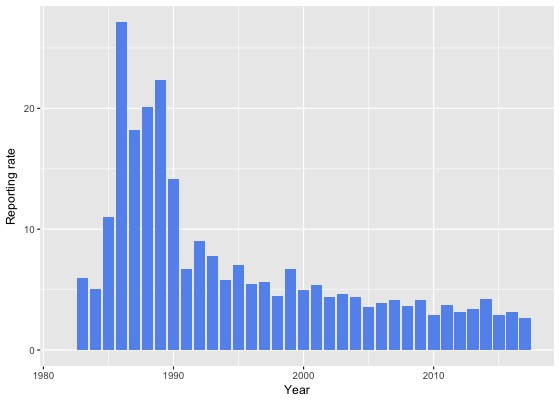
Reporting rate by month
This chart shows the reporting rate by month of Eastern Yellow Robin. The blue lines show the reporting rate for the twelve months to June 2017 and the bars show the average reporting rate for the period 1982 to 2017. 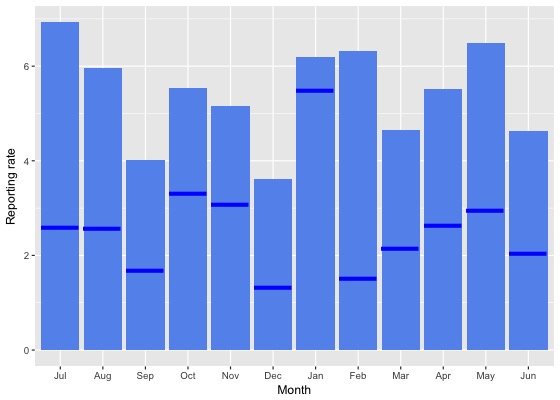
Reporting rate by season
This chart shows the seasonal reporting rate of Eastern Yellow Robin. The blue lines show the seasonal reporting rate for the twelve months to June 2017 and the bars show the average seasonal reporting rate for the period 1982 to 2017. 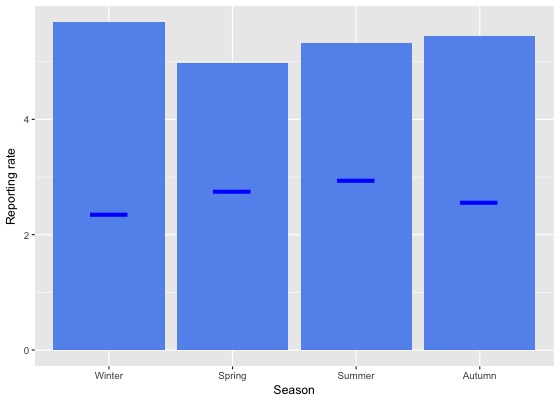
Reporting rate data
| Month | Season | ||||||||||||||||||
|---|---|---|---|---|---|---|---|---|---|---|---|---|---|---|---|---|---|---|---|
| Period | Jul | Aug | Sep | Oct | Nov | Dec | Jan | Feb | Mar | Apr | May | Jun | Winter | Spring | Summer | Autumn | All | ||
| All years | |||||||||||||||||||
| All | 6.9 | 6.0 | 4.0 | 5.5 | 5.2 | 3.6 | 6.2 | 6.3 | 4.7 | 5.5 | 6.5 | 4.6 | 5.7 | 5.0 | 5.3 | 5.5 | 5.3 | ||
| Previous years | |||||||||||||||||||
| All previous years | 7.6 | 6.6 | 4.3 | 5.9 | 5.5 | 4.0 | 6.3 | 7.3 | 5.1 | 6.0 | 7.3 | 5.1 | 6.3 | 5.3 | 5.8 | 6.0 | 5.8 | ||
| Previous 30 years | 7.4 | 6.6 | 4.2 | 5.8 | 5.2 | 3.9 | 6.2 | 7.2 | 4.9 | 5.8 | 7.2 | 5.0 | 6.2 | 5.1 | 5.7 | 5.8 | 5.6 | ||
| Previous 20 years | 4.9 | 4.3 | 2.5 | 4.7 | 2.7 | 2.2 | 4.6 | 5.3 | 3.2 | 3.9 | 4.8 | 3.2 | 4.0 | 3.5 | 3.9 | 3.9 | 3.8 | ||
| 10 year groups | |||||||||||||||||||
| [2007,2017) | 3.8 | 3.6 | 1.8 | 4.5 | 2.0 | 1.6 | 4.4 | 4.2 | 3.1 | 3.8 | 4.1 | 3.0 | 3.4 | 3.1 | 3.4 | 3.6 | 3.4 | ||
| [1997,2007) | 6.9 | 5.8 | 3.8 | 5.2 | 4.2 | 3.1 | 5.2 | 8.2 | 3.5 | 4.2 | 6.5 | 3.5 | 5.2 | 4.4 | 5.1 | 4.4 | 4.7 | ||
| [1987,1997) | 16.3 | 13.5 | 13.0 | 12.2 | 13.4 | 13.5 | 15.4 | 16.2 | 14.5 | 15.7 | 16.3 | 14.4 | 14.6 | 12.8 | 15.0 | 15.5 | 14.4 | ||
| 5 year groups | |||||||||||||||||||
| [2012,2017) | 3.7 | 3.2 | 1.9 | 4.5 | 1.6 | 1.7 | 4.2 | 3.6 | 2.9 | 3.8 | 3.7 | 3.6 | 3.5 | 3.0 | 3.3 | 3.4 | 3.3 | ||
| [2007,2012) | 4.0 | 4.8 | 1.7 | 4.6 | 3.1 | 1.5 | 5.2 | 7.1 | 3.6 | 3.9 | 5.3 | 2.1 | 3.2 | 3.5 | 4.0 | 4.1 | 3.7 | ||
| [2002,2007) | 6.7 | 5.5 | 3.1 | 4.6 | 4.0 | 2.9 | 5.1 | 6.5 | 2.5 | 4.0 | 5.8 | 2.6 | 4.7 | 3.9 | 4.4 | 3.8 | 4.2 | ||
| [1997,2002) | 7.1 | 6.3 | 4.6 | 6.1 | 4.4 | 3.5 | 5.3 | 9.9 | 4.8 | 4.4 | 7.3 | 4.7 | 5.8 | 5.0 | 5.9 | 5.3 | 5.5 | ||
| [1992,1997) | 9.5 | 7.2 | 5.1 | 5.4 | 7.5 | 3.8 | 8.4 | 8.6 | 6.6 | 8.0 | 8.2 | 5.3 | 7.2 | 6.1 | 6.9 | 7.5 | 6.9 | ||
| [1987,1992) | 19.3 | 16.9 | 16.7 | 15.8 | 16.3 | 17.8 | 19.3 | 19.0 | 19.1 | 20.1 | 20.5 | 19.6 | 18.5 | 16.2 | 18.7 | 19.9 | 18.2 | ||
| Year | |||||||||||||||||||
| 2017 | 2.6 | 2.6 | 1.7 | 3.3 | 3.1 | 1.3 | 5.5 | 1.5 | 2.2 | 2.6 | 3.0 | 2.0 | 2.3 | 2.8 | 2.9 | 2.6 | 2.7 | ||
| 2016 | 4.2 | 3.3 | 2.5 | 3.8 | 1.6 | 1.0 | 4.2 | 4.3 | 2.8 | 3.0 | 3.0 | 3.1 | 3.5 | 2.8 | 3.4 | 2.9 | 3.1 | ||
| 2015 | 2.6 | 3.1 | 1.7 | 4.2 | 1.8 | 1.7 | 3.1 | 3.0 | 3.1 | 3.6 | 2.3 | 3.6 | 3.2 | 2.8 | 2.6 | 3.1 | 2.9 | ||
| 2014 | 2.4 | 2.9 | 1.3 | 5.8 | 1.5 | 3.5 | 5.6 | 2.9 | 3.6 | 6.4 | 6.6 | 4.4 | 3.6 | 3.6 | 4.4 | 5.2 | 4.2 | ||
| 2013 | 4.5 | 5.0 | 1.9 | 5.9 | 1.8 | 1.7 | 4.2 | 2.6 | 2.4 | 2.3 | 7.1 | 3.6 | 4.3 | 3.6 | 2.8 | 3.3 | 3.4 | ||
| 2012 | 4.3 | 2.0 | 1.2 | 3.8 | 0.8 | 1.9 | 4.2 | 4.4 | 2.7 | 5.8 | 2.7 | 3.3 | 3.2 | 2.4 | 3.5 | 4.0 | 3.1 | ||
| 2011 | 4.1 | 4.8 | 1.6 | 4.2 | 4.8 | 0.6 | 5.9 | 7.3 | 4.4 | 3.4 | 4.7 | 1.2 | 2.5 | 3.6 | 4.3 | 4.2 | 3.7 | ||
| 2010 | 9.4 | 1.8 | 1.1 | 4.6 | 2.4 | 1.1 | 2.4 | 2.4 | 1.6 | 5.5 | 2.9 | 1.5 | 3.2 | 3.2 | 1.8 | 3.4 | 2.9 | ||
| 2009 | 1.4 | 5.2 | 1.9 | 5.5 | 1.8 | 1.6 | 6.7 | 9.2 | 6.5 | 4.1 | 3.8 | 2.7 | 2.8 | 3.8 | 5.2 | 4.9 | 4.1 | ||
| 2008 | 2.8 | 6.1 | 3.0 | 3.6 | 5.4 | 2.3 | 8.7 | 5.6 | 1.6 | 2.8 | 6.3 | 1.4 | 3.0 | 3.7 | 4.8 | 3.1 | 3.6 | ||
| 2007 | 4.4 | 6.5 | 0.8 | 5.0 | 2.0 | 2.3 | 3.9 | 9.6 | 3.8 | 4.3 | 8.9 | 3.6 | 4.3 | 3.2 | 4.2 | 5.1 | 4.1 | ||
| 2006 | 5.3 | 5.8 | 1.8 | 5.4 | 4.2 | 1.7 | 3.4 | 5.2 | 2.9 | 3.2 | 7.2 | 3.1 | 4.3 | 4.1 | 3.3 | 3.9 | 3.9 | ||
| 2005 | 5.9 | 0.9 | 3.3 | 3.3 | 2.8 | 5.2 | 6.4 | 7.6 | 1.7 | 2.7 | 4.5 | 1.1 | 2.4 | 3.2 | 6.0 | 2.9 | 3.5 | ||
| 2004 | 7.1 | 7.2 | 4.8 | 4.1 | 6.4 | 2.3 | 6.1 | 8.1 | 1.0 | 2.7 | 2.9 | 1.2 | 5.5 | 5.1 | 4.8 | 2.1 | 4.4 | ||
| 2003 | 11.1 | 5.8 | 3.0 | 3.6 | 3.2 | 3.0 | 4.4 | 4.4 | 4.0 | 6.0 | 7.8 | 3.7 | 6.5 | 3.2 | 3.8 | 5.6 | 4.6 | ||
| 2002 | 5.1 | 6.8 | 2.5 | 5.6 | 3.5 | 2.1 | 5.7 | 8.6 | 2.3 | 4.8 | 7.1 | 4.3 | 5.2 | 3.9 | 4.5 | 4.0 | 4.4 | ||
| 2001 | 7.1 | 5.4 | 5.3 | 7.1 | 4.0 | 4.3 | 1.5 | 12.9 | 3.3 | 4.9 | 7.5 | 2.5 | 5.1 | 5.6 | 6.0 | 4.8 | 5.4 | ||
| 2000 | 7.1 | 4.6 | 2.3 | 4.0 | 5.6 | 2.7 | 5.8 | 7.6 | 5.7 | 5.3 | 2.7 | 7.0 | 6.2 | 4.0 | 5.1 | 5.0 | 5.0 | ||
| 1999 | 8.8 | 9.3 | 5.2 | 7.5 | 7.1 | 4.4 | 10.9 | 12.9 | 5.4 | 3.1 | 9.1 | 2.8 | 5.2 | 6.6 | 9.2 | 5.8 | 6.7 | ||
| 1998 | 2.7 | 11.3 | 6.5 | 5.4 | 1.8 | 1.9 | 2.9 | 1.9 | 2.2 | 2.6 | 18.5 | 5.3 | 6.7 | 4.6 | 2.2 | 5.0 | 4.4 | ||
| 1997 | 8.0 | 3.4 | 3.6 | 6.6 | 1.7 | 3.8 | 5.9 | 8.8 | 15.0 | 4.6 | 4.4 | 9.7 | 7.4 | 3.6 | 5.7 | 6.7 | 5.6 | ||
| 1996 | 13.4 | 4.3 | 1.3 | 5.3 | 5.6 | 4.0 | 5.8 | 8.2 | 2.0 | 9.4 | 6.9 | 3.4 | 6.5 | 4.4 | 5.9 | 5.4 | 5.5 | ||
| 1995 | 15.1 | 8.5 | 4.9 | 4.9 | 10.0 | 5.7 | 8.8 | 4.8 | 5.1 | 5.6 | 5.2 | 5.3 | 9.5 | 6.4 | 6.8 | 5.4 | 7.0 | ||
| 1994 | 5.9 | 6.5 | 2.9 | 8.1 | 1.5 | 0.0 | 7.4 | 15.5 | 6.8 | 6.1 | 6.2 | 5.6 | 6.0 | 3.8 | 8.1 | 6.4 | 5.8 | ||
| 1993 | 4.1 | 9.0 | 4.8 | 2.7 | 9.1 | 4.3 | 14.3 | 0.0 | 13.6 | 11.7 | 7.8 | 7.2 | 7.1 | 5.4 | 7.1 | 11.0 | 7.8 | ||
| 1992 | 4.6 | 7.4 | 10.6 | 6.4 | 16.7 | 3.2 | 8.6 | 12.2 | 7.0 | 11.9 | 14.5 | 5.0 | 5.6 | 10.8 | 7.4 | 11.2 | 9.0 | ||
| 1991 | 3.1 | 5.3 | 3.5 | 4.9 | 8.2 | 1.4 | 14.3 | 12.0 | 6.3 | 13.6 | 6.6 | 12.0 | 5.5 | 5.6 | 8.3 | 8.7 | 6.7 | ||
| 1990 | 18.7 | 21.6 | 21.5 | 3.1 | 12.1 | 8.3 | 12.5 | 8.5 | 8.0 | 13.1 | 20.5 | 9.2 | 18.3 | 12.1 | 9.8 | 13.5 | 14.1 | ||
| 1989 | 21.4 | 19.0 | 20.1 | 21.2 | 21.2 | 25.7 | 24.5 | 26.3 | 23.3 | 20.0 | 26.3 | 21.4 | 20.5 | 20.8 | 25.5 | 23.0 | 22.4 | ||
| 1988 | 26.7 | 16.0 | 17.4 | 19.5 | 13.1 | 22.6 | 23.1 | 20.0 | 25.7 | 19.3 | 21.7 | 19.8 | 20.7 | 16.5 | 22.0 | 22.3 | 20.1 | ||
| 1987 | 18.2 | 13.3 | 15.8 | 16.0 | 19.7 | 13.7 | 14.4 | 17.1 | 17.7 | 24.7 | 19.2 | 23.5 | 22.6 | 17.4 | 15.2 | 20.7 | 18.2 | ||
| 1986 | 30.8 | 13.2 | 28.3 | 19.4 | 29.8 | 17.6 | 43.5 | 30.6 | 35.5 | 29.4 | 20.7 | 31.4 | 24.2 | 26.5 | 29.0 | 28.8 | 27.1 | ||
| 1985 | 13.3 | 10.0 | 5.8 | 10.5 | 15.8 | 6.7 | 12.5 | 11.8 | 18.2 | 10.5 | 30.0 | 10.7 | 11.4 | 10.8 | 8.2 | 17.5 | 11.0 | ||
| 1984 | 0.0 | 0.0 | 0.0 | 0.0 | 0.0 | 0.0 | 13.8 | 3.0 | 14.8 | 2.9 | 6.5 | 0.0 | 0.0 | 0.0 | 6.8 | 7.6 | 5.1 | ||
| 1983 | 0.0 | 0.0 | 0.0 | 7.7 | 44.4 | 7.7 | 0.0 | 0.0 | 0.0 | - | 0.0 | 0.0 | 0.0 | 18.5 | 3.3 | 0.0 | 6.0 | ||
| 1982 | - | 0.0 | - | 0.0 | 0.0 | 0.0 | - | 0.0 | - | 0.0 | - | 0.0 | 0.0 | 0.0 | 0.0 | 0.0 | 0.0 | ||
Breeding data
Breeding records by month
Number of breeding records by breeding code and month, 2017 and all years| Breeding code | Jul | Aug | Sep | Oct | Nov | Dec | Jan | Feb | Mar | Apr | May | Jun |
|---|---|---|---|---|---|---|---|---|---|---|---|---|
| 2017 | ||||||||||||
| Breeding (BLA code) | 0 | 0 | 0 | 1 | 0 | 0 | 0 | 0 | 0 | 0 | 0 | 0 |
| Carrying Food | 0 | 0 | 0 | 0 | 0 | 0 | 0 | 0 | 0 | 0 | 0 | 0 |
| Copulating | 0 | 0 | 0 | 0 | 0 | 0 | 0 | 0 | 0 | 0 | 0 | 0 |
| Display | 0 | 0 | 0 | 0 | 1 | 0 | 0 | 0 | 0 | 0 | 0 | 0 |
| Dependent young | 0 | 0 | 0 | 1 | 0 | 0 | 0 | 1 | 1 | 0 | 0 | 0 |
| Faecal sac | 0 | 0 | 0 | 0 | 0 | 0 | 0 | 0 | 0 | 0 | 0 | 0 |
| Inspecting hollow | 0 | 0 | 0 | 0 | 0 | 0 | 0 | 0 | 0 | 0 | 0 | 0 |
| Nest building | 0 | 0 | 0 | 0 | 0 | 0 | 0 | 0 | 0 | 0 | 0 | 0 |
| Nest with eggs | 0 | 0 | 0 | 0 | 0 | 0 | 0 | 0 | 0 | 0 | 0 | 0 |
| Nest with young | 0 | 0 | 0 | 0 | 0 | 0 | 0 | 0 | 0 | 0 | 0 | 0 |
| On/leaving nest | 0 | 0 | 0 | 0 | 1 | 0 | 1 | 0 | 0 | 0 | 0 | 0 |
| All years | ||||||||||||
| Breeding (BLA code) | 0 | 0 | 0 | 2 | 0 | 0 | 2 | 1 | 0 | 0 | 0 | 0 |
| Carrying Food | 0 | 0 | 0 | 8 | 2 | 1 | 2 | 0 | 0 | 0 | 0 | 0 |
| Copulating | 0 | 0 | 0 | 0 | 0 | 0 | 0 | 0 | 0 | 0 | 0 | 0 |
| Display | 0 | 0 | 0 | 0 | 1 | 0 | 0 | 0 | 0 | 0 | 0 | 0 |
| Dependent young | 0 | 0 | 1 | 7 | 3 | 6 | 10 | 9 | 4 | 0 | 0 | 0 |
| Faecal sac | 0 | 0 | 0 | 0 | 0 | 0 | 0 | 0 | 0 | 0 | 0 | 0 |
| Inspecting hollow | 0 | 0 | 0 | 0 | 0 | 0 | 0 | 0 | 0 | 0 | 0 | 0 |
| Nest building | 0 | 3 | 0 | 7 | 2 | 2 | 2 | 0 | 0 | 0 | 0 | 0 |
| Nest with eggs | 0 | 2 | 1 | 1 | 3 | 1 | 0 | 1 | 0 | 0 | 0 | 0 |
| Nest with young | 0 | 0 | 0 | 0 | 1 | 2 | 1 | 0 | 0 | 0 | 0 | 0 |
| On/leaving nest | 0 | 3 | 0 | 1 | 2 | 0 | 1 | 0 | 0 | 0 | 0 | 0 |
Breeding records by year
Average number of breeding records per period by breeding code| Period | Breeding (BLA code) | Carrying Food | Copulating | Display | Dependent young | Faecal sac | Inspecting hollow | Nest building | Nest with eggs | Nest with young | On/leaving nest |
|---|---|---|---|---|---|---|---|---|---|---|---|
| All years | |||||||||||
| All | 0.1 | 0.4 | 0.0 | 0.0 | 1.1 | 0.0 | 0.0 | 0.4 | 0.2 | 0.1 | 0.2 |
| Previous years | |||||||||||
| All previous years | 0.1 | 0.4 | 0.0 | 0.0 | 1.1 | 0.0 | 0.0 | 0.5 | 0.3 | 0.1 | 0.1 |
| Previous 30 years | 0.1 | 0.4 | 0.0 | 0.0 | 1.2 | 0.0 | 0.0 | 0.5 | 0.3 | 0.1 | 0.2 |
| Previous 20 years | 0.2 | 0.3 | 0.0 | 0.0 | 0.9 | 0.0 | 0.0 | 0.1 | 0.1 | 0.0 | 0.2 |
| 10 year groups | |||||||||||
| [2007,2017) | 0.4 | 0.5 | 0.0 | 0.0 | 1.1 | 0.0 | 0.0 | 0.2 | 0.3 | 0.0 | 0.4 |
| [1997,2007) | 0.0 | 0.1 | 0.0 | 0.0 | 0.7 | 0.0 | 0.0 | 0.1 | 0.0 | 0.0 | 0.0 |
| [1987,1997) | 0.0 | 0.7 | 0.0 | 0.0 | 1.8 | 0.0 | 0.0 | 1.2 | 0.5 | 0.3 | 0.1 |
| 5 year groups | |||||||||||
| [2012,2017) | 0.4 | 1.0 | 0.0 | 0.0 | 1.6 | 0.0 | 0.0 | 0.4 | 0.6 | 0.0 | 0.8 |
| [2007,2012) | 0.4 | 0.0 | 0.0 | 0.0 | 0.6 | 0.0 | 0.0 | 0.0 | 0.0 | 0.0 | 0.0 |
| [2002,2007) | 0.0 | 0.0 | 0.0 | 0.0 | 1.0 | 0.0 | 0.0 | 0.0 | 0.0 | 0.0 | 0.0 |
| [1997,2002) | 0.0 | 0.2 | 0.0 | 0.0 | 0.4 | 0.0 | 0.0 | 0.2 | 0.0 | 0.0 | 0.0 |
| [1992,1997) | 0.0 | 0.0 | 0.0 | 0.0 | 0.2 | 0.0 | 0.0 | 0.2 | 0.0 | 0.0 | 0.0 |
| [1987,1992) | 0.0 | 1.4 | 0.0 | 0.0 | 3.4 | 0.0 | 0.0 | 2.2 | 1.0 | 0.6 | 0.2 |
| Year | |||||||||||
| 2017 | 1.0 | 0.0 | 0.0 | 1.0 | 3.0 | 0.0 | 0.0 | 0.0 | 0.0 | 0.0 | 2.0 |
| 2016 | 0.0 | 0.0 | 0.0 | 0.0 | 2.0 | 0.0 | 0.0 | 2.0 | 0.0 | 0.0 | 0.0 |
| 2015 | 0.0 | 1.0 | 0.0 | 0.0 | 3.0 | 0.0 | 0.0 | 0.0 | 2.0 | 0.0 | 0.0 |
| 2014 | 1.0 | 1.0 | 0.0 | 0.0 | 2.0 | 0.0 | 0.0 | 0.0 | 0.0 | 0.0 | 1.0 |
| 2013 | 0.0 | 3.0 | 0.0 | 0.0 | 1.0 | 0.0 | 0.0 | 0.0 | 1.0 | 0.0 | 3.0 |
| 2012 | 1.0 | 0.0 | 0.0 | 0.0 | 0.0 | 0.0 | 0.0 | 0.0 | 0.0 | 0.0 | 0.0 |
| 2011 | 1.0 | 0.0 | 0.0 | 0.0 | 0.0 | 0.0 | 0.0 | 0.0 | 0.0 | 0.0 | 0.0 |
| 2010 | 0.0 | 0.0 | 0.0 | 0.0 | 1.0 | 0.0 | 0.0 | 0.0 | 0.0 | 0.0 | 0.0 |
| 2009 | 0.0 | 0.0 | 0.0 | 0.0 | 0.0 | 0.0 | 0.0 | 0.0 | 0.0 | 0.0 | 0.0 |
| 2008 | 0.0 | 0.0 | 0.0 | 0.0 | 1.0 | 0.0 | 0.0 | 0.0 | 0.0 | 0.0 | 0.0 |
| 2007 | 1.0 | 0.0 | 0.0 | 0.0 | 1.0 | 0.0 | 0.0 | 0.0 | 0.0 | 0.0 | 0.0 |
| 2006 | 0.0 | 0.0 | 0.0 | 0.0 | 3.0 | 0.0 | 0.0 | 0.0 | 0.0 | 0.0 | 0.0 |
| 2005 | 0.0 | 0.0 | 0.0 | 0.0 | 1.0 | 0.0 | 0.0 | 0.0 | 0.0 | 0.0 | 0.0 |
| 2004 | 0.0 | 0.0 | 0.0 | 0.0 | 0.0 | 0.0 | 0.0 | 0.0 | 0.0 | 0.0 | 0.0 |
| 2003 | 0.0 | 0.0 | 0.0 | 0.0 | 1.0 | 0.0 | 0.0 | 0.0 | 0.0 | 0.0 | 0.0 |
| 2002 | 0.0 | 0.0 | 0.0 | 0.0 | 0.0 | 0.0 | 0.0 | 0.0 | 0.0 | 0.0 | 0.0 |
| 2001 | 0.0 | 0.0 | 0.0 | 0.0 | 0.0 | 0.0 | 0.0 | 0.0 | 0.0 | 0.0 | 0.0 |
| 2000 | 0.0 | 0.0 | 0.0 | 0.0 | 0.0 | 0.0 | 0.0 | 1.0 | 0.0 | 0.0 | 0.0 |
| 1999 | 0.0 | 1.0 | 0.0 | 0.0 | 2.0 | 0.0 | 0.0 | 0.0 | 0.0 | 0.0 | 0.0 |
| 1998 | 0.0 | 0.0 | 0.0 | 0.0 | 0.0 | 0.0 | 0.0 | 0.0 | 0.0 | 0.0 | 0.0 |
| 1997 | 0.0 | 0.0 | 0.0 | 0.0 | 0.0 | 0.0 | 0.0 | 0.0 | 0.0 | 0.0 | 0.0 |
| 1996 | 0.0 | 0.0 | 0.0 | 0.0 | 0.0 | 0.0 | 0.0 | 0.0 | 0.0 | 0.0 | 0.0 |
| 1995 | 0.0 | 0.0 | 0.0 | 0.0 | 0.0 | 0.0 | 0.0 | 0.0 | 0.0 | 0.0 | 0.0 |
| 1994 | 0.0 | 0.0 | 0.0 | 0.0 | 0.0 | 0.0 | 0.0 | 1.0 | 0.0 | 0.0 | 0.0 |
| 1993 | 0.0 | 0.0 | 0.0 | 0.0 | 1.0 | 0.0 | 0.0 | 0.0 | 0.0 | 0.0 | 0.0 |
| 1992 | 0.0 | 0.0 | 0.0 | 0.0 | 0.0 | 0.0 | 0.0 | 0.0 | 0.0 | 0.0 | 0.0 |
| 1991 | 0.0 | 0.0 | 0.0 | 0.0 | 0.0 | 0.0 | 0.0 | 0.0 | 0.0 | 0.0 | 1.0 |
| 1990 | 0.0 | 0.0 | 0.0 | 0.0 | 0.0 | 0.0 | 0.0 | 0.0 | 0.0 | 0.0 | 0.0 |
| 1989 | 0.0 | 2.0 | 0.0 | 0.0 | 7.0 | 0.0 | 0.0 | 5.0 | 1.0 | 1.0 | 0.0 |
| 1988 | 0.0 | 5.0 | 0.0 | 0.0 | 4.0 | 0.0 | 0.0 | 4.0 | 4.0 | 0.0 | 0.0 |
| 1987 | 0.0 | 0.0 | 0.0 | 0.0 | 6.0 | 0.0 | 0.0 | 2.0 | 0.0 | 2.0 | 0.0 |
| 1986 | 0.0 | 0.0 | 0.0 | 0.0 | 0.0 | 0.0 | 0.0 | 1.0 | 1.0 | 1.0 | 0.0 |
| 1985 | 0.0 | 0.0 | 0.0 | 0.0 | 1.0 | 0.0 | 0.0 | 0.0 | 0.0 | 0.0 | 0.0 |
| 1984 | 0.0 | 0.0 | 0.0 | 0.0 | 0.0 | 0.0 | 0.0 | 0.0 | 0.0 | 0.0 | 0.0 |
| 1983 | 0.0 | 0.0 | 0.0 | 0.0 | 0.0 | 0.0 | 0.0 | 0.0 | 0.0 | 0.0 | 0.0 |
| 1982 | 0.0 | 0.0 | 0.0 | 0.0 | 0.0 | 0.0 | 0.0 | 0.0 | 0.0 | 0.0 | 0.0 |
Distribution map
Distribution - 2017
This map shows the observed distribution of the Eastern Yellow Robin for 2017.
The red circles are the grid cells where Eastern Yellow Robin have been reported.
The transparency of the red circles indicate how many surveys sheets were submitted for that grid cell; the darker the red the more reliable the data. Of the 315 grid cells with reports, 83 had only one sheet; an example is grid number A11.
The size of the circle represents the reporting rate. The maximum reporting rate for Eastern Yellow Robin was 100.0% (eg grid number A11) and the minimum was 0.5% (eg grid number J13). 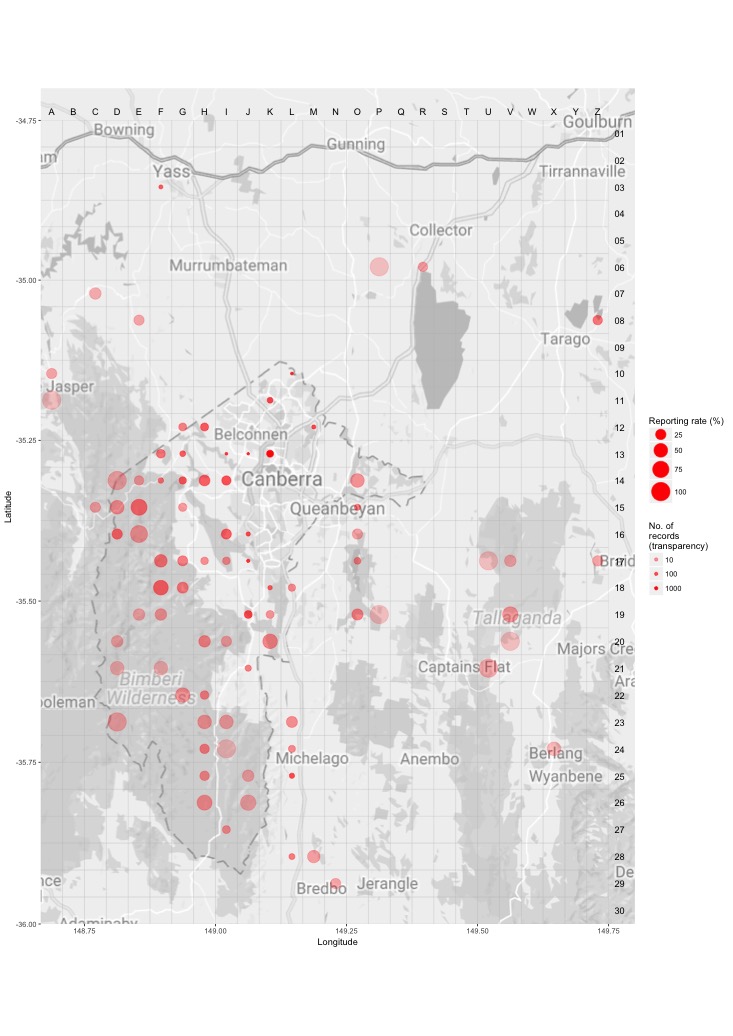
Distribution - all years
This map shows the observed distribution of the Eastern Yellow Robin for all years.
The red circles are the grid cells where Eastern Yellow Robin have been reported.
The transparency of the red circles indicate how many surveys sheets were submitted for that grid cell; the darker the red the more reliable the data. Of the 703 grid cells with reports, 55 had only one sheet; an example is grid number C10.
The size of the circle represents the reporting rate. The maximum reporting rate for Eastern Yellow Robin was 100.0% (eg grid number C10) and the minimum was 0.1% (eg grid number L14). 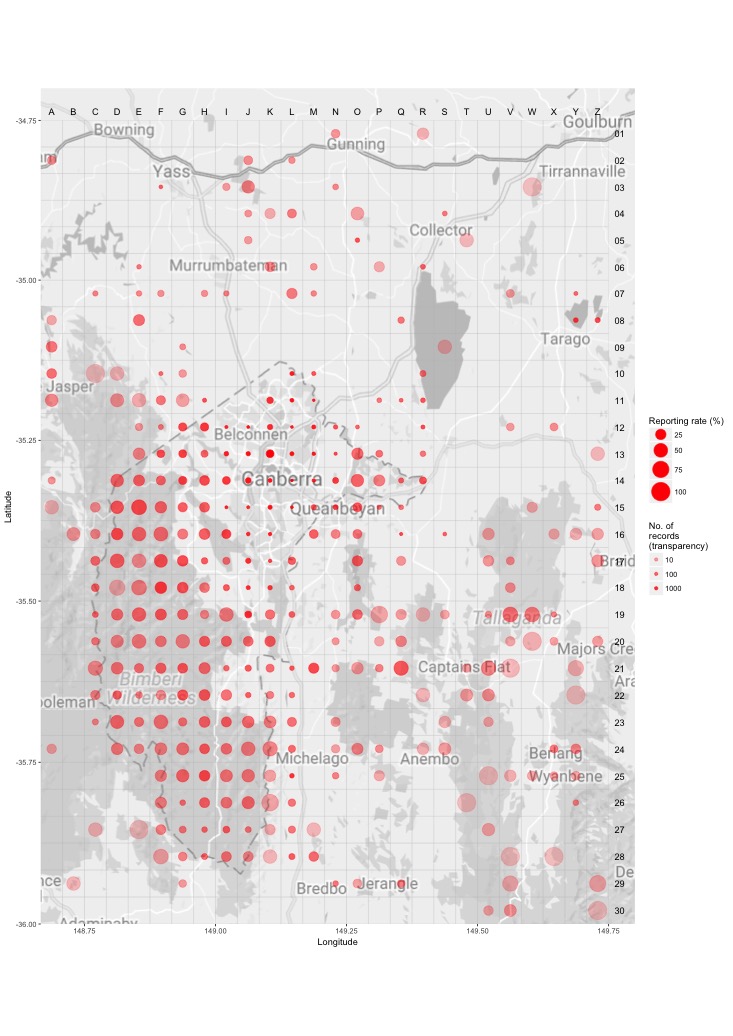
Breeding map
Breeding - 2017
This map shows the breeding distribution of the Eastern Yellow Robin for 2017.
The red circles are the grid cells where breeding activity for Eastern Yellow Robin have been reported.
The size of the circle represents the number of reports. 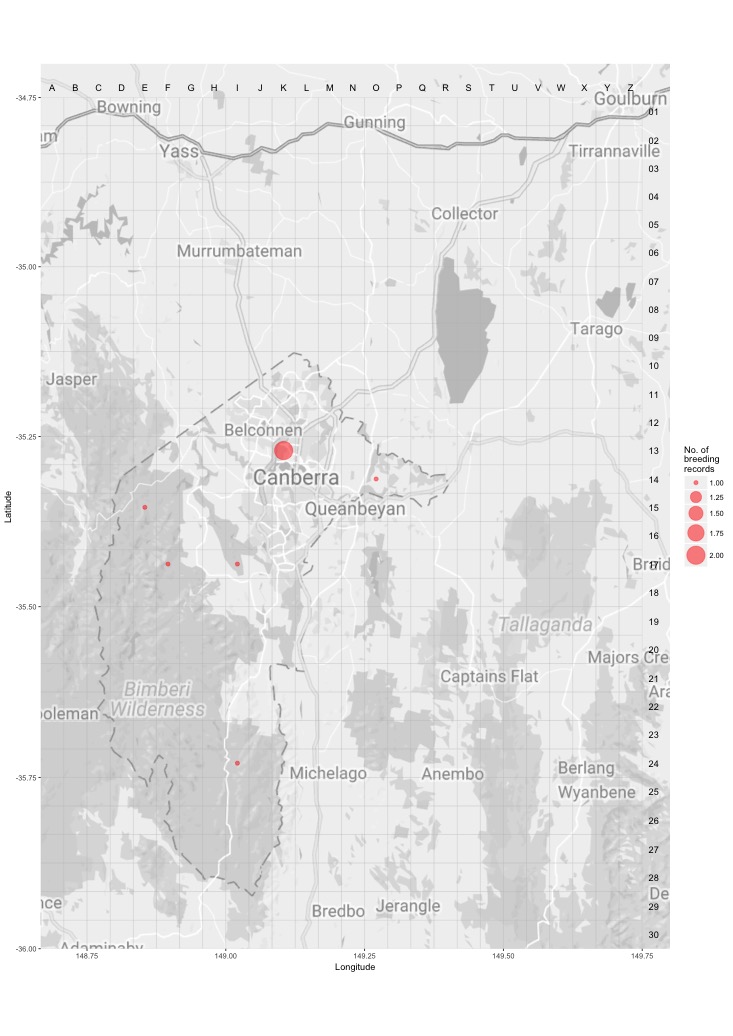
Breeding - all years
This map shows the breeding distribution of the Eastern Yellow Robin for all years.
The red circles are the grid cells where breeding activity for Eastern Yellow Robin have been reported.
The size of the circle represents the number of reports. 